Loudspeaker Coverage Mapping
The Mapping workspace in Fulcrum One allows for fast, powerful real-time coverage prediction of loudspeakers and loudspeaker systems in room models. Loudspeakers may be rapidly moved, aligned, and processed, and their associated performance updated on a spatial coverage map in real-time, allowing for an extremely efficient design workflow.
To begin mapping a system, make sure you've selected the Mapping workspace using the tab at the top of the window.

Preparing the model
To map loudspeaker coverage in a model, we need to enable model surfaces to receive and display energy from the loudspeaker system. You can enable any 3D model surface as a mapping plane in your project. Obviously, audience areas are of primary importance, however, you can also easily enable things like stage surfaces or walls to see how much energy is being projected onto those areas.
To enable a surface, click the surface in your 3D model. In the Properties toolbox, enable mapping on that surface using the  control. The model will immediately add that surface to the visualization. Alternately, you may right-click the surface and check Mapping in the context menu.
 control. The model will immediately add that surface to the visualization. Alternately, you may right-click the surface and check Mapping in the context menu.
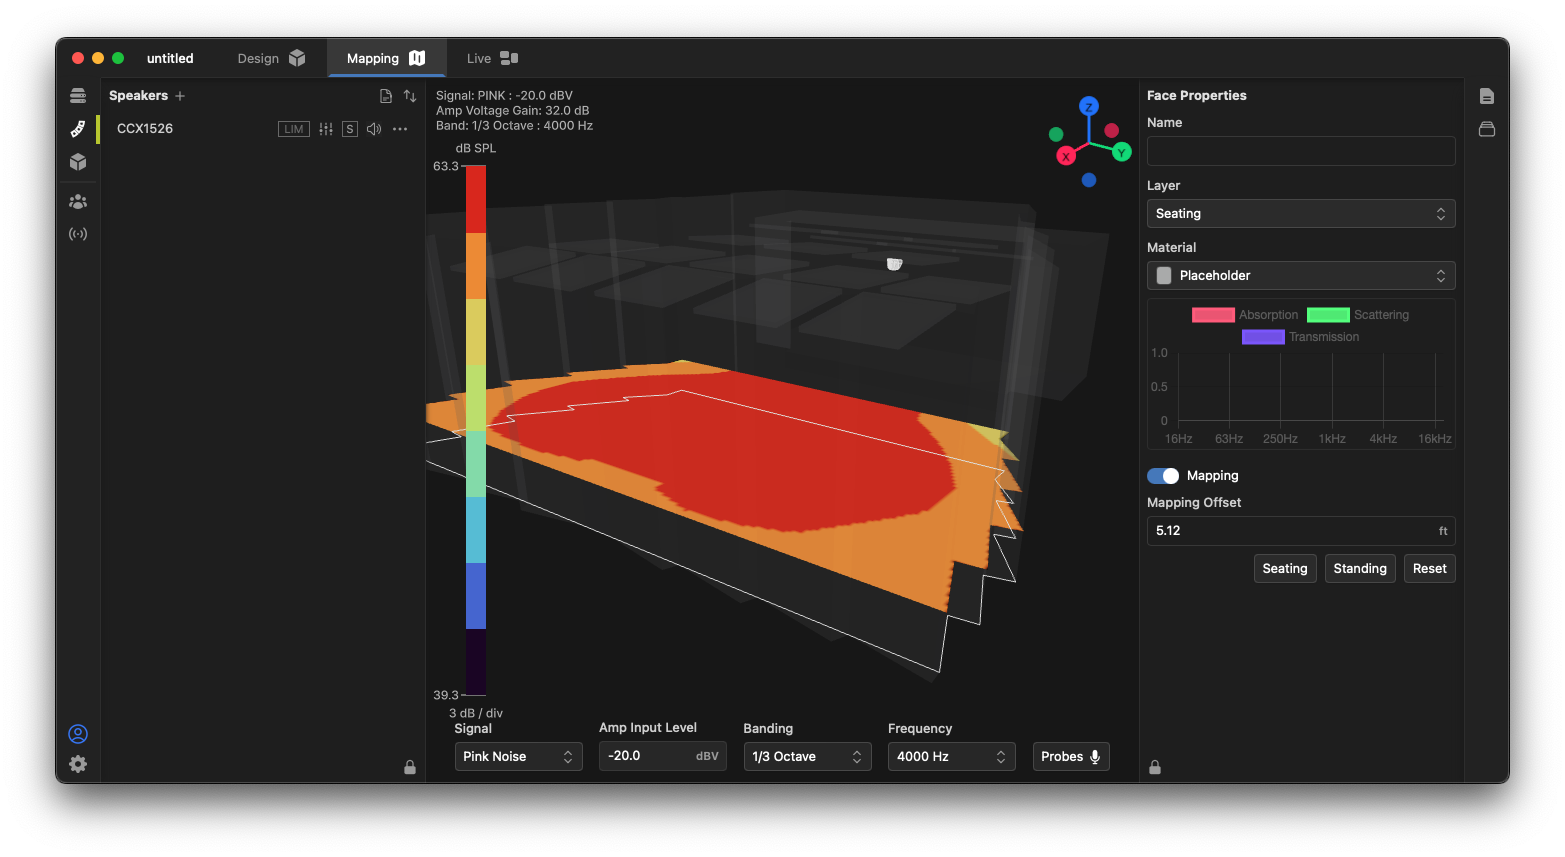
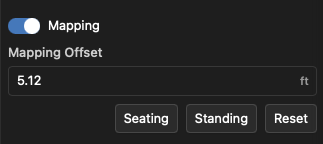
By default, an enabled surface calculates and displays the mapping data in the same plane as that surface. You can, however, offset that mapping to a distance away from the plane. This is useful for drawing improvised audience planes above, for example, a floor-level surface in a model. In the Properties toolbox, enter the offset height as a number, or click the Seating or Standing presets to create an offset equal to a standard seated or standing ear height.
Mapping settings
The calculation and visualization of mapping results is widely customizable using the Settings  menu. This includes customizing the simulated amplifier and input levels, changing weighting, banding and center frequency settings, and customizing the mapping rendering itself.
 menu. This includes customizing the simulated amplifier and input levels, changing weighting, banding and center frequency settings, and customizing the mapping rendering itself.
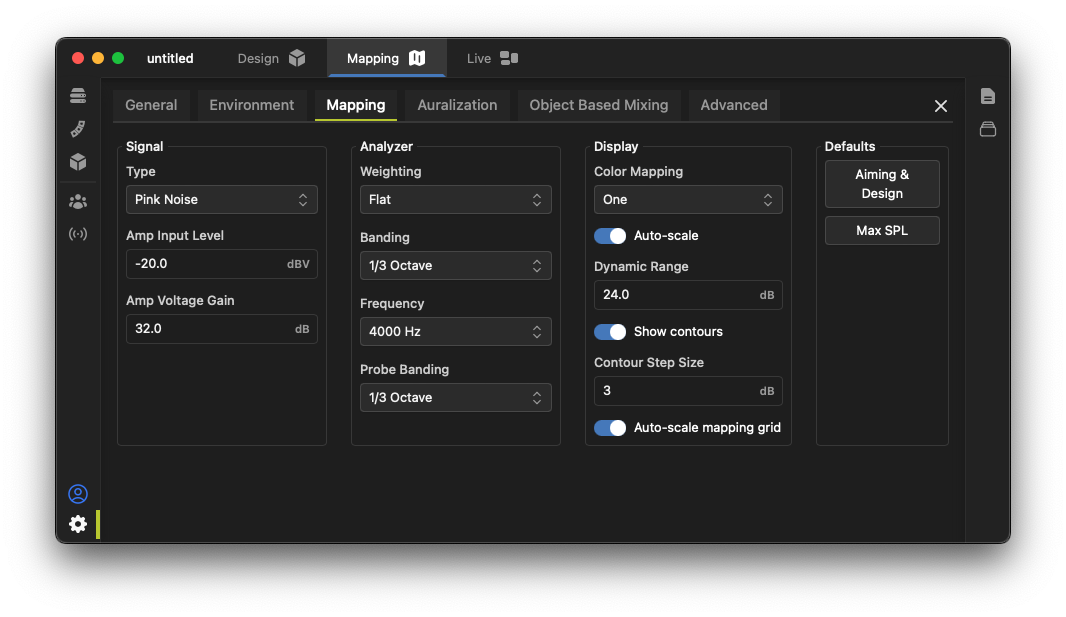
Fulcrum has provided two primary "presets" that set the system up for two major tasks facing a system designer:
- Aiming & Design: Provides a contour plot that allows easy viewing of standard coverage edges for aiming loudspeakers and judging coverage and level calibration throughout a system design.
- Max SPL: Provides a smooth surface plot showing the maximum SPL capacity of the system when each device is driven to its maximum ability.
Aiming and design
In the Settings dialog, click the Aiming & Design preset button.

The display will show a mapping of the current system state, scaled to the maximum SPL across the venue.
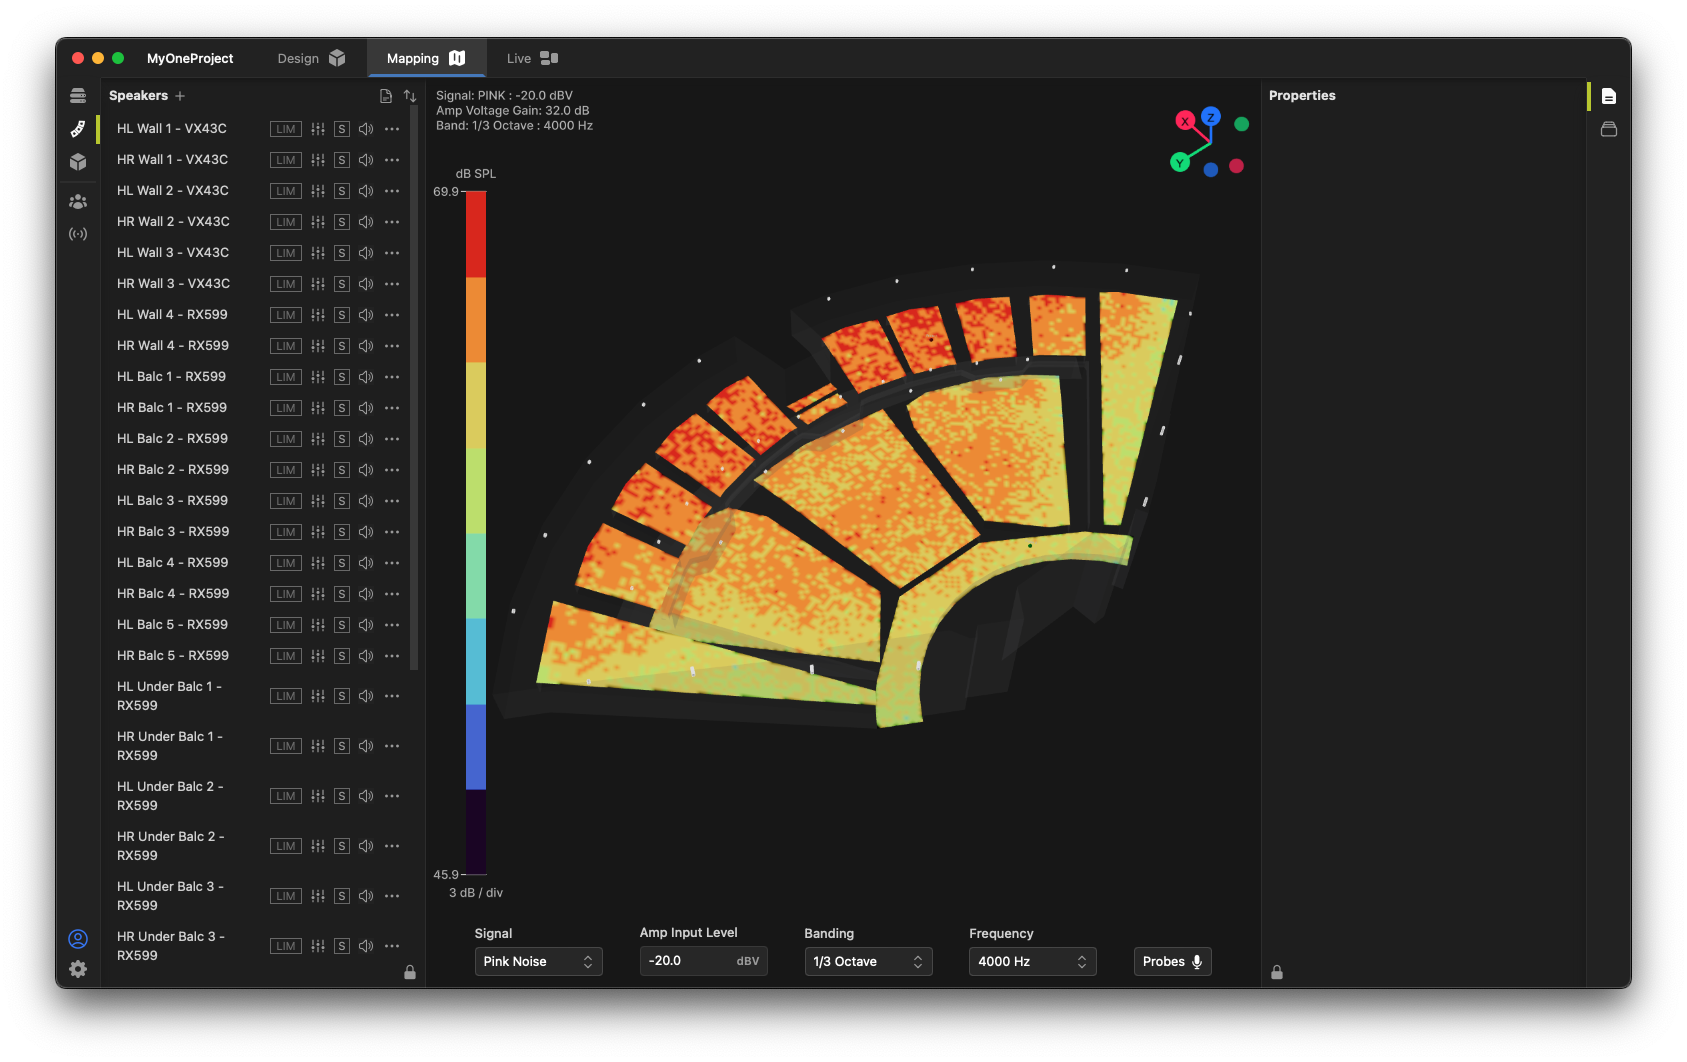
You can quickly and easily change the excitation signal, the simulated input signal level, and the banding & center frequency of the simulation using the controls at the bottom of the window.

Individual speakers can be controlled from the Speaker toolbox. It is typically helpful to selectively mute or solo loudspeakers to help with adjusting individual loudspeakers.

Solo an individual speaker to see its contribution to the venue coverage.
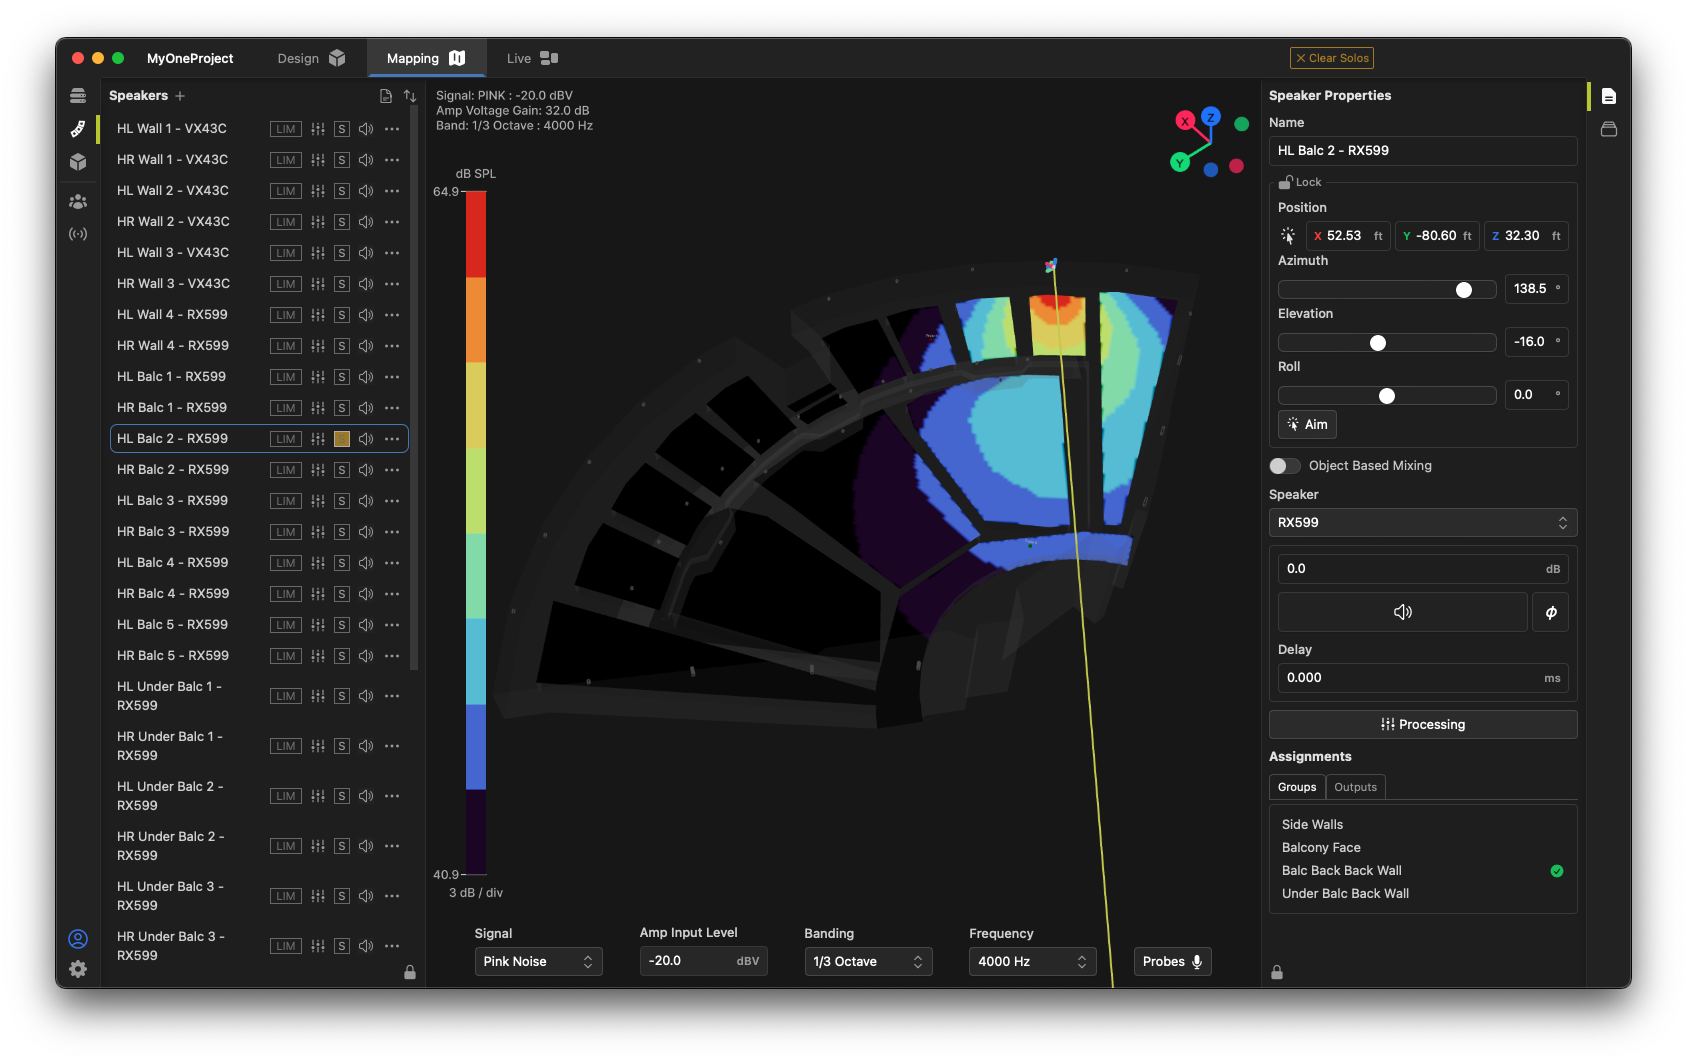
Just like in the Design workspace, you can select a loudspeaker and quickly move or position it using its Properties toolbox. In addition, the position  and aiming
  tools are also available in Mapping workspace.
 and aiming
  tools are also available in Mapping workspace.
Note that speaker groups, speaker signal processing, gains and delays all affect the mapping results, so a processed system can be realistically modeled in the venue. Levels and filters can be "roughed in" and quickly equated to real DSP when the system is implemented.
The headroom available for an individual loudspeaker with the current signal settings can be viewed by hovering over the  indicator in the Speakers list. Above its rated output, a simulated speaker will "limit" and gain reduction will be shown.
 indicator in the Speakers list. Above its rated output, a simulated speaker will "limit" and gain reduction will be shown.
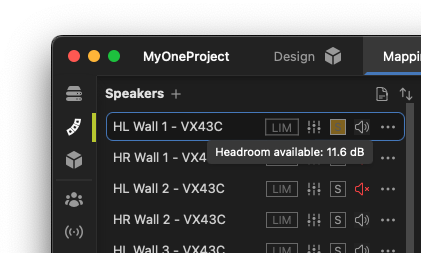
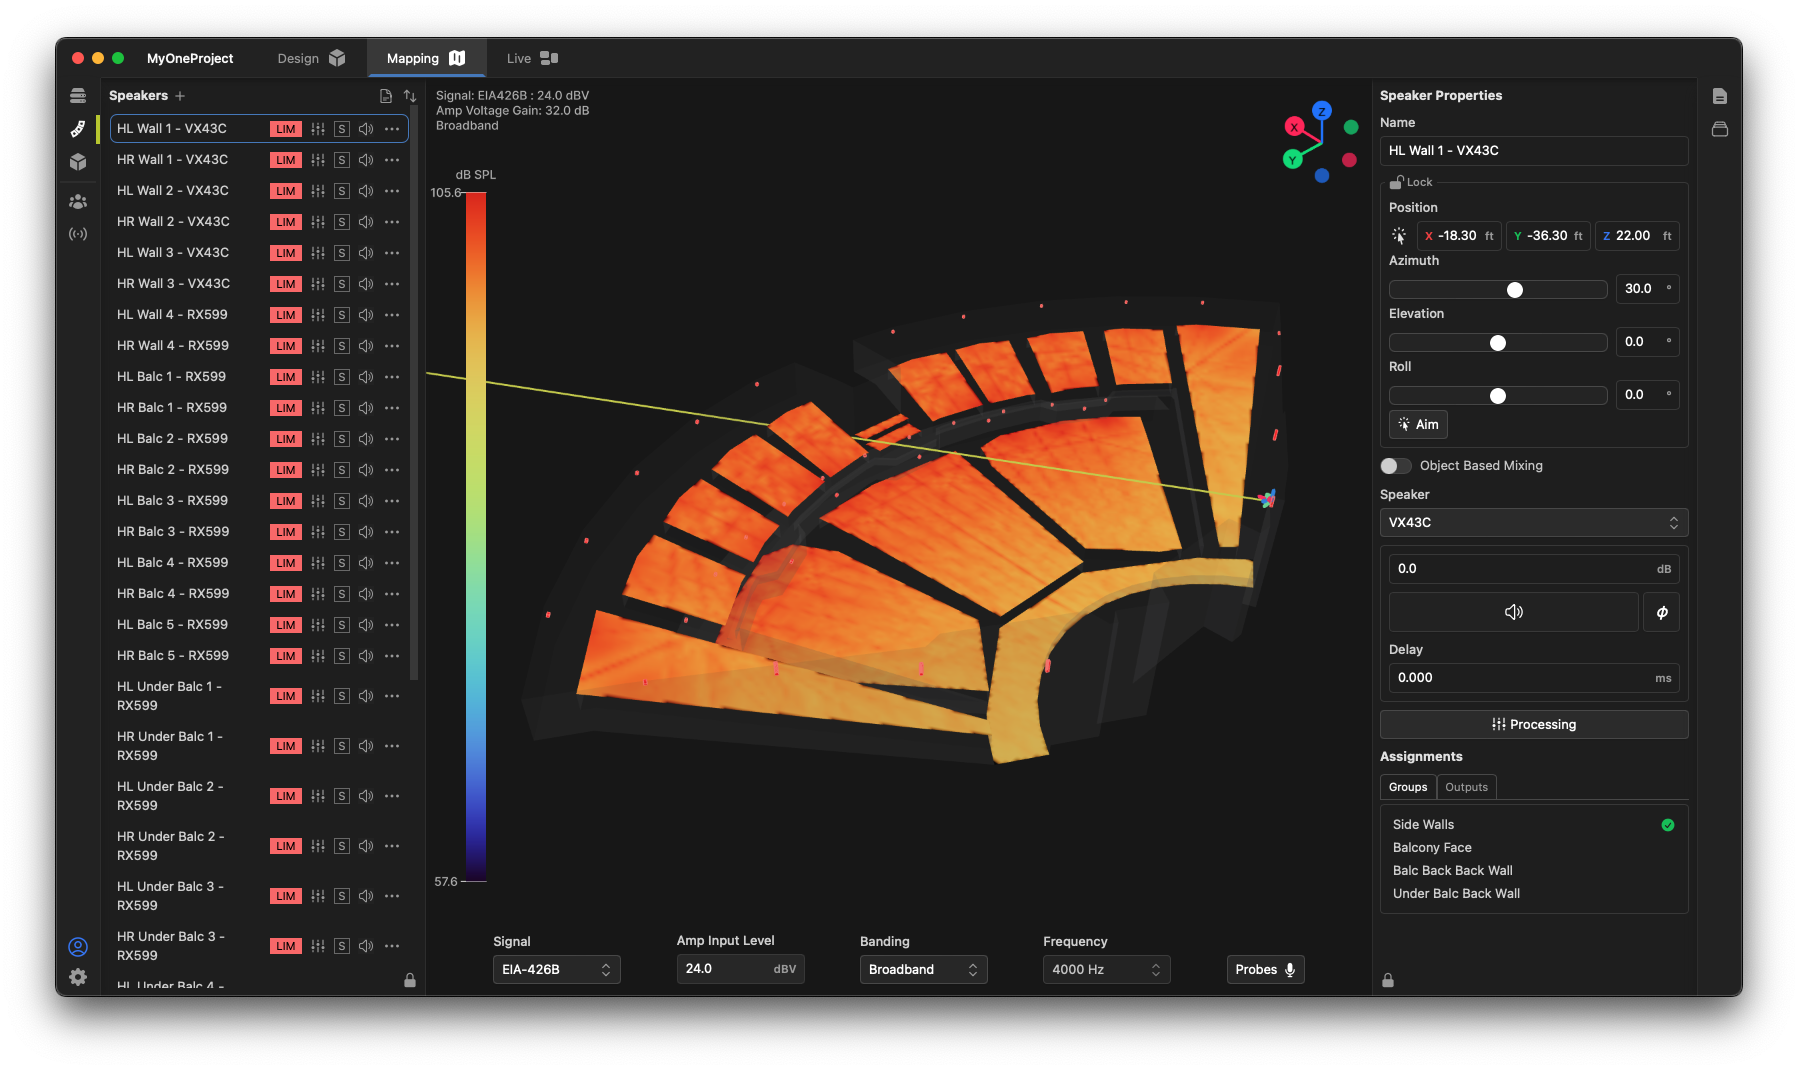
Max SPL
To display the theoretical maximum SPL performance of a system, click the Max SPL preset button in the settings window.

In this preset, the simulated input signal is "raised" to its maximum, thereby driving all speakers into their "limits". In addition, an EIA-426B signal is used, approximating a music program source. This can be easily changed by the user. The coverage map shows the theoretical maximum with all speakers driven to their individual limits on a broadband basis.
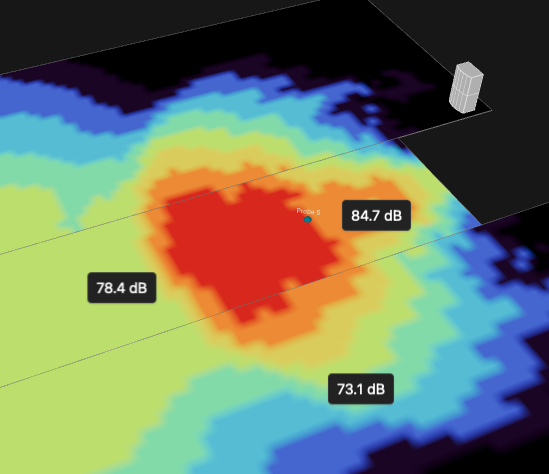
SPL readouts
Hovering the mouse over the mapping area will display a readout of the mapped level at that location, reflecting the level shown on the mapping color scale. You can "drop" multiple temporary readouts on the screen by holding the ALT key (Windows) or the Option key (MacOS) while clicking on the surface. Design or processing parameters may be changed and the results seen on the respective readouts. To remove all readouts, hit the ESC key.
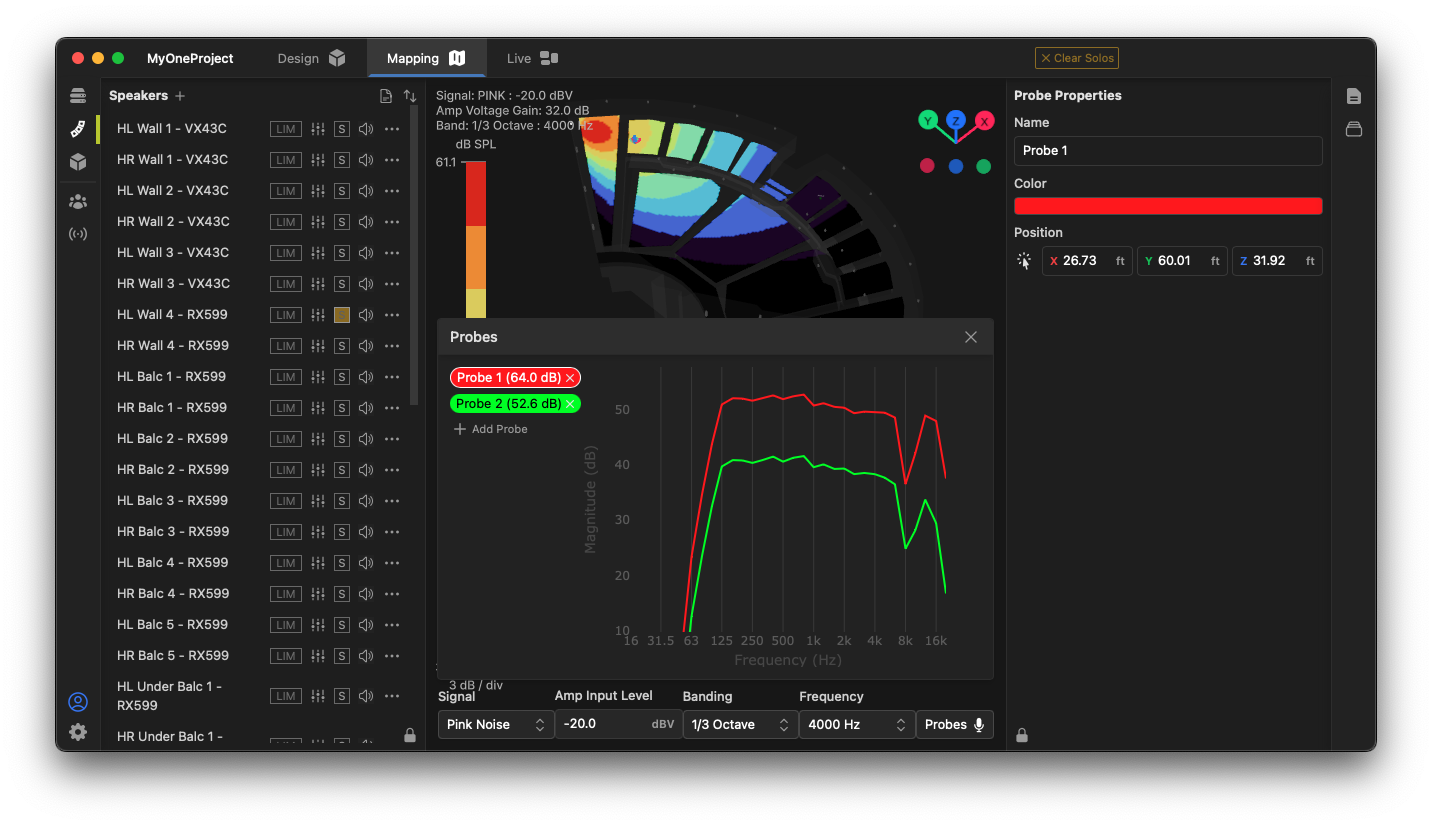
Viewing a spectrum with probes
Probes allow you to view spectrum data at selected individual points in a model, as if there were a real-time analyzer placed at those locations. Clicking the probes button opens the probes window:

To add a probe, click the  button in the Probes window. The probe may be easily positioned using the function in the Probe Properties toolbox. Multiple probes may be added to compare spectra at different locations.
 button in the Probes window. The probe may be easily positioned using the